Gold Is Coiling: The Next Leg Is Critical — What Traders Must Watch Now
Lismore Burke
August 5, 2026
Gold has entered an
interesting technical setup. Following an amazing bullish rise that saw the
commodity reach an all-time high level in late January 2026, the price has now
retraced significantly and has entered into consolidation trading at around $4,173.
The next move will probably be a significant price move, and the macro events
lined up in the coming weeks will determine which direction gold will take.
The Technical Setup: Compression Before Expansion
On the daily chart,
price is confined within a sideways channel, bound by a support level at $3,950
and a resistance level at $4,200 after undergoing an extended period of
correction. Price is currently trading at $4,173, which is 2.34% higher for the
day.
The key structural
levels formed by volume and moving averages are:
Point of Control
(POC): Volume has accumulated heavily around $4,093.25, forming a strong demand
floor that provides immediate support if price pulls back.
Resistance: A move higher and a daily close above $4,200
would mean a break above the low-volume node zone with immediate exposure to
the volume profile's upper value area boundary near $4,398.50. A move through
that level, and separately through the descending 100-day moving average, would
set the next major level of high-volume resistance between $4,500 and $4,700
within reach.
Momentum: The 14-day RSI is trading at 55.38 and has
gone bullish with sufficient space above it but without getting close to
overbought territory.
Downside
Risk: If price breaks below the channel level support at $3,950 would
invalidate the consolidation base with immediate support at $3,650-$3,750.
XAUUSD, Time frame: 1Day, Source: Tradingview
The Fed's Inflation Rethink: Five Task Forces
The single biggest
catalyst for gold's next move is the Federal Reserve's restructuring of its
monetary policy approach. Under Chairman Kevin Warsh, the Fed announced in July
2026 the creation of five independent task forces to examine core areas of policy,
including one specifically on Inflation Frameworks, led by economists Greg
Mankiw, Thomas Sargent, and William White. Despite the task force not having
released any official reports, its formation implies that the Fed is now
questioning whether its conventional approach will be able to handle the new
economy that includes infrastructure spending on AI, supply chain
reorganization, and constant price pressures.
Fed projections for
mid-2026 reveal an unfavorable situation, where PCE inflation is projected at
3.6%, while core PCE is at 3.3%, both being significantly above the target
level of 2%. Additionally, expectations for year-over-year inflation based on
the NY Fed Survey of Consumer Expectations hold steady at 3.4%. With the
Inflation Frameworks Task Force signaling their willingness to allow higher
inflation to protect labor markets, real rates will fall rapidly even when
interest rates are high. That is the ideal environment for gold. On the
contrary, if the review prompts a renewed hawkish stance, the opportunity cost
of holding non-yielding assets rises, and gold likely breaks down.
Geopolitics: Strait of Hormuz
Beyond monetary policy, gold's
advance is also being supported by rising geopolitical tensions in the Strait
of Hormuz. In recent trading sessions, gold prices have reacted sharply to
developments suggesting either an escalation or easing of the conflict. This
safe-haven demand exists independently of the real-yield dynamic and can drive
gold higher even when the US dollar and interest rates remain firm. Traders
should closely monitor any signs of a ceasefire or broader de-escalation.
The Dollar and Yields: The Twin Anchors
The negative
correlation between gold and the USD and Treasury rates remains the main macro
factor that affects gold's price movement. Currently, the 10-year Treasury
yield is at around 4.63%, which is close to the top of the 52-week range.
The key dynamic to
track is real yields. If nominal yields stay anchored near 4.6% while inflation
expectations creep higher under the Fed's evolving framework, real yields fall,
driving gold higher. However, if markets begin pricing in additional Fed rate
hikes, real yields could spike and force gold to test its major $3,950 support
floor. Simultaneously, a rising DXY above 102 would press gold lower.
Summary
Gold is not bullish or
bearish at this point, according to analysts, but rather is coiled at a very
important level. The outcome of the ongoing squeeze will be highly dependent on
how incoming economic prints influence real rates and the U.S. dollar.
Disclaimer: The content published above has been prepared by CFI for informational purposes only and should not be considered as investment advice. Any view expressed does not constitute a personal recommendation or solicitation to buy or sell. The information provided does not have regard to the specific investment objectives, financial situation, and needs of any specific person who may receive it, and is not held out as independent investment research and may have been acted upon by persons connected with CFI. Market data is derived from independent sources believed to be reliable, however, CFI makes no guarantee of its accuracy or completeness, and accepts no responsibility for any consequence of its use by recipients.






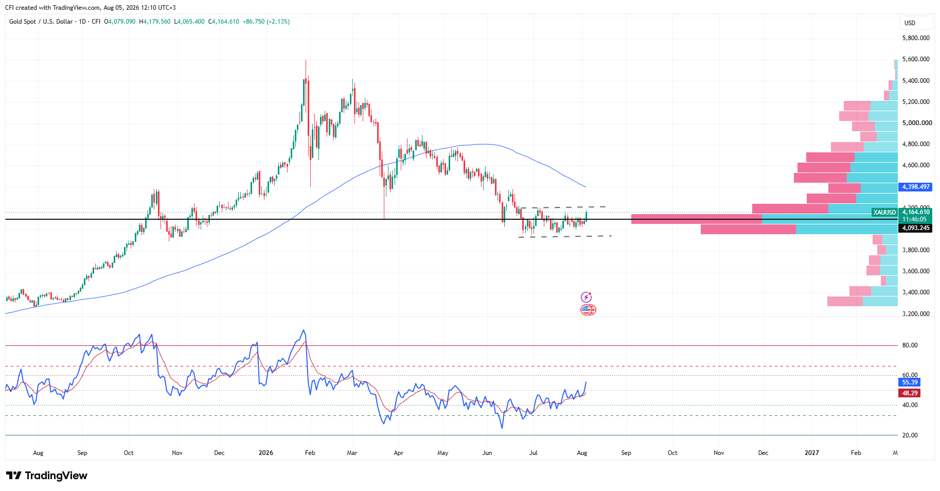 XAUUSD, Time frame: 1Day, Source: Tradingview
-1786613672.webp)

-1786351521.webp)

-1786101287.webp)
-1724934015.webp)
