Nasdaq 100 1D Technical Analysis: Tech Stocks Under Pressure
Lismore Burke
October 15, 2026
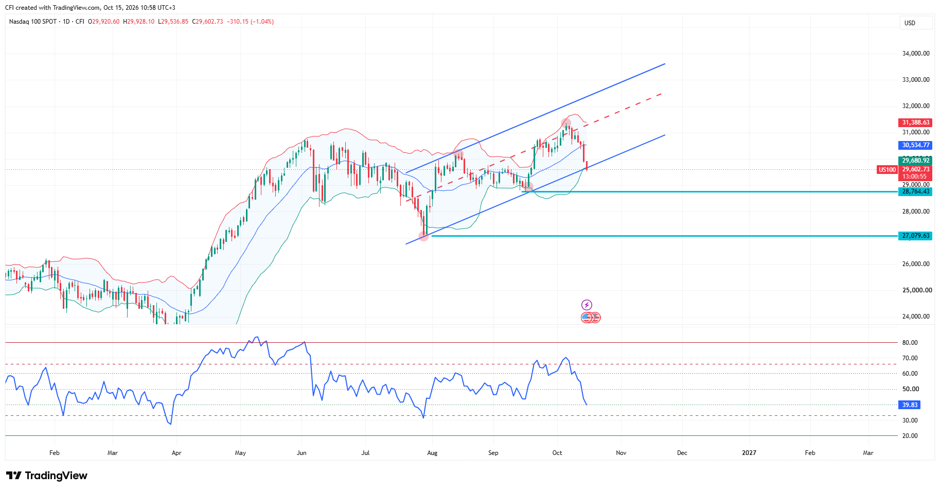
US100, Time frame: 1 Daily
The Nasdaq 100 continues to trade within a
well-defined rising channel, with higher highs and higher lows supporting the
broader advance from the April low. However, recent price action has weakened
after another rejection near the upper half of the channel, bringing attention
back to trend support.
Channel Support
The latest selloff has pushed the index
toward the lower boundary of the ascending channel, which currently intersects
around 29,600-29,700. This area is particularly important because it has
repeatedly acted as support throughout the August-October advance.
The current reaction will determine whether
buyers can maintain the channel structure or whether a deeper correction
develops.
20-Day Moving Average Comes Under
Pressure
Price has slipped below the 20-day moving
average near 30,535, suggesting short-term momentum has deteriorated following
the rejection from recent highs.
The moving average is now becoming the
first resistance level overhead and may limit any initial recovery attempts.
28,764 Remains Key Structural Support
Beneath current price, the 28,764 support
level remains the most important horizontal support area on the chart. This
zone previously acted as resistance before turning into support during the
August breakout.
A break below channel support could bring
this level into focus.
RSI Reflects Momentum Deterioration
The RSI has fallen sharply to approximately
40, dropping below its 59 moving average.
This shift highlights weakening bullish
momentum and reflects the strongest pullback since the September advance.
However, RSI remains above oversold territory, suggesting the market has not
yet reached exhausted conditions.
Bollinger Bands Signal Expanding
Volatility
Price has moved from the upper Bollinger
Band toward the lower half of the Bollinger range, highlighting the recent
increase in volatility. The rejection from the upper band near 31,387
reinforces the loss of upside momentum seen over the past several sessions.
Disclaimer: The content published above has been prepared by CFI for informational purposes only and should not be considered as investment advice. Any view expressed does not constitute a personal recommendation or solicitation to buy or sell. The information provided does not have regard to the specific investment objectives, financial situation, and needs of any specific person who may receive it, and is not held out as independent investment research and may have been acted upon by persons connected with CFI. Market data is derived from independent sources believed to be reliable, however, CFI makes no guarantee of its accuracy or completeness, and accepts no responsibility for any consequence of its use by recipients.





 US100, Time frame: 1 Daily