The
Dow Jones (US30) continues to respect a well-defined ascending channel,
maintaining a sequence of higher highs and higher lows that has supported the
recovery from October's lows. While recent price action has become more
volatile, buyers have repeatedly defended key support levels, keeping the
broader bullish structure intact.
With price now trading near the upper end of its range,
traders are watching a critical resistance zone that could determine the
market's next major move.
52,500 remains the line in the sand
The most important level on the chart is the 52,499
resistance zone.
Multiple rallies have stalled near this area, confirming it
as a significant barrier for buyers. Adding to its importance, the volume
profile highlights substantial activity around this level, suggesting it
represents an area where market participants have consistently found value.
A convincing break above 52,500 could trigger fresh
momentum and potentially attract breakout traders looking for a continuation of
the broader uptrend.
Buyers continue to defend channel
support
Despite repeated tests of resistance, sellers have struggled
to gain meaningful control.
The latest pullback found support near 52,000, close
to the lower boundary of the ascending channel. The strong reaction from this
area reinforces the notion that buyers remain active on dips and continue to
view short-term weakness as a buying opportunity.
As long as the channel remains intact, the path of least
resistance continues to favor the upside.
Volume profile
One of the most notable features of the current setup is the
concentration of trading activity between 52,000 and 52,500.
This high-volume region suggests the market is currently in a
state of acceptance, with buyers and sellers actively transacting within a
well-established value area. Markets rarely remain balanced for long, and
periods of consolidation often precede stronger directional moves.
The longer price remains trapped within this range, the more
significant the eventual breakout could become.
RSI reflects a balanced market
The Relative Strength Index is currently hovering around 49,
almost perfectly aligned with the neutral 50 level.
Unlike many trending markets where RSI pushes into extreme
territory, the current reading highlights a lack of dominant momentum from
either side. This mirrors the ongoing consolidation beneath resistance and
suggests traders are waiting for a catalyst before committing to a larger move.
A push above 60 would strengthen the bullish case, while a
drop below 40 could signal increasing downside pressure.
Disclaimer: The content published above has been prepared by CFI for informational purposes only and should not be considered as investment advice. Any view expressed does not constitute a personal recommendation or solicitation to buy or sell. The information provided does not have regard to the specific investment objectives, financial situation, and needs of any specific person who may receive it, and is not held out as independent investment research and may have been acted upon by persons connected with CFI. Market data is derived from independent sources believed to be reliable, however, CFI makes no guarantee of its accuracy or completeness, and accepts no responsibility for any consequence of its use by recipients.





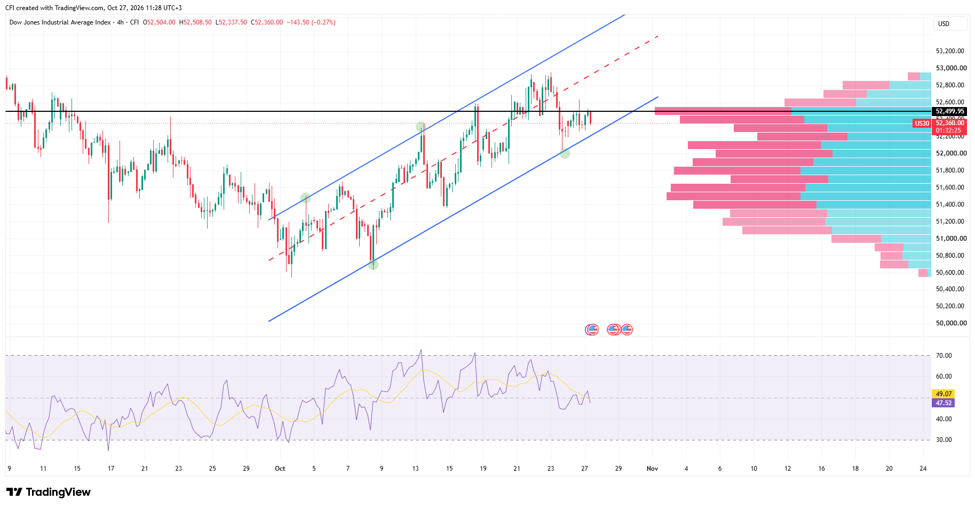 US30, Time frame: 4H
