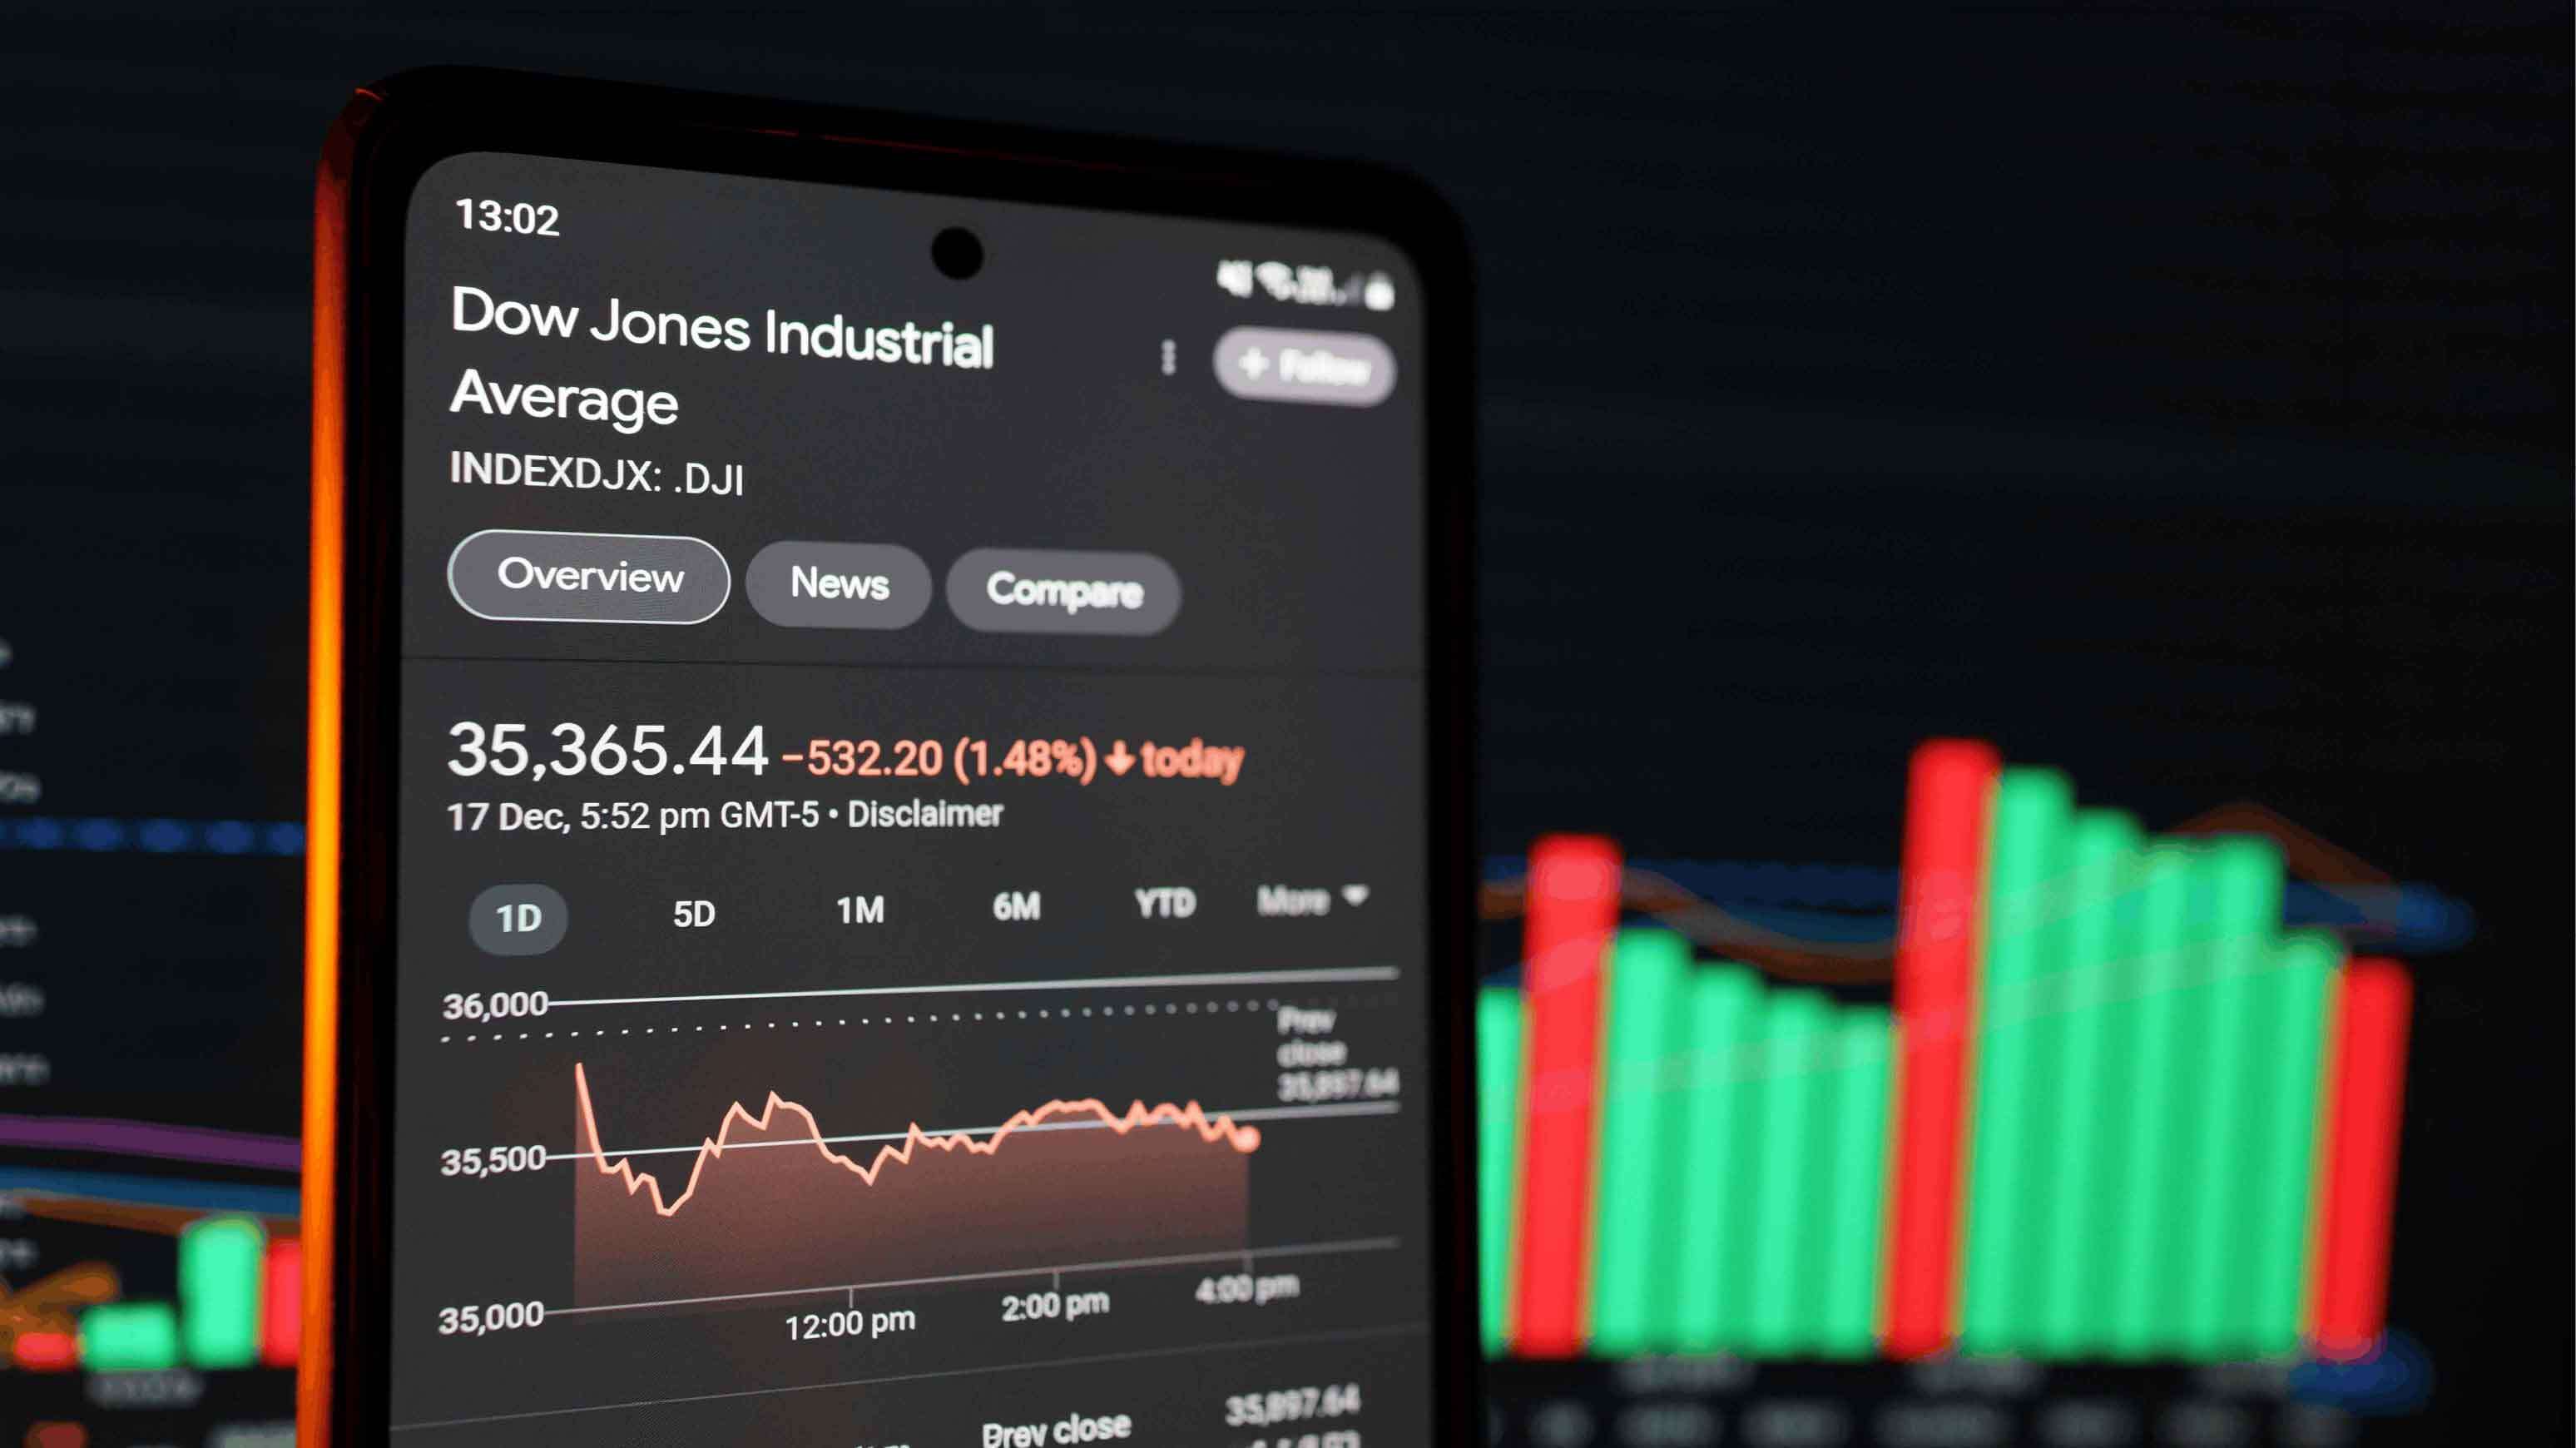
The Nasdaq Composite ended Tuesday, October 20, slightly lower, pressured by declines in major technology stocks, including Apple and Meta. Meanwhile, a pullback in oil prices after an earlier rise helped support broader US markets as investors assessed corporate earnings.
Technology and artificial intelligence earnings remain key drivers for the Nasdaq 100. Investors are weighing the growth opportunities created by expanding AI infrastructure against higher borrowing costs. Strong preliminary results from Super Micro, together with positive news from SpaceX, supported technology stocks in premarket trading on Wednesday. Investors are also looking ahead to Tesla and Meta’s results, due after the market close.
As a result, the index may remain sensitive to corporate earnings and signs of demand for AI technologies, as well as developments in oil prices and borrowing costs. Continued pressure on technology stocks could limit recovery attempts, while strong results may support investor risk appetite.
Technical analysis of the Nasdaq 100
Figure: US100, Time frame: H4, Source: TradingView
The Nasdaq 100 is in a broader downtrend on the four-hour chart, forming successively lower highs and lower lows. The price is also trading below the simple moving average, pointing to continued selling pressure in the short term.
The latest move shows the price rebounding toward a supply zone between the 78.6% and 88% Fibonacci retracement levels, at 29,819.51 and 29,909.29, respectively. If the downward momentum continues, the index could decline to test 29,294.20.
The alternative scenario would require the price to rise above 30,023.90 and form a higher high. This could signal a shift in the bearish structure and open the way for another attempt to move higher.
Disclaimer: The content published above has been prepared by CFI for informational purposes only and should not be considered as investment advice. Any view expressed does not constitute a personal recommendation or solicitation to buy or sell. The information provided does not have regard to the specific investment objectives, financial situation, and needs of any specific person who may receive it, and is not held out as independent investment research and may have been acted upon by persons connected with CFI. Market data is derived from independent sources believed to be reliable, however, CFI makes no guarantee of its accuracy or completeness, and accepts no responsibility for any consequence of its use by recipients.


 Figure: US100, Time frame: H4, Source: TradingView