USDJPY 4H Technical Analysis: Will the BoJ Step in Again?
Lismore Burke
September 23, 2026
USDJPY, Time frame: 4H
USD/JPY has staged an impressive recovery
from the September low near 153.00, forming a clear sequence of higher highs
and higher lows over the past two weeks. The rebound follows an aggressive
selloff that drove the pair from the 160.00 area toward the lows, creating a
V-shaped recovery structure.
200-EMA Break in Focus
The most important technical development is
the test of the 200-period EMA near 157.40.
The pair spent most of September trading
below this long-term trend indicator, but the latest rally has brought price
back into direct contact with it. The 200-EMA is often viewed as a key trend
filter, making the current test particularly important for determining whether
the recovery can extend further.
160.00–160.50 Supply Zone
The green-highlighted zone between 160.00
and 160.60 remains the major resistance area on the chart.
This region previously acted as support
before the sharp breakdown earlier this month and is likely to attract renewed
selling interest if the recovery continues. Price is still trading below this
supply zone despite the recent strength.
Ascending Trendline Supports the
Recovery
The rally from the September lows continues
to be supported by a rising trendline. Recent pullbacks have respected this
structure, suggesting buyers remain active on dips and that the short-term
recovery trend remains intact.
As long as the pair remains above the
trendline, the recovery structure remains constructive.
RSI Signals Strengthening Momentum
The RSI has climbed to approximately 68,
its highest reading since the recent rebound began.
While
approaching overbought territory, the indicator continues to trend higher,
reflecting strong upside momentum and improving buyer participation. The
persistent move above the neutral 50 level supports the current recovery phase.
Disclaimer: The content published above has been prepared by CFI for informational purposes only and should not be considered as investment advice. Any view expressed does not constitute a personal recommendation or solicitation to buy or sell. The information provided does not have regard to the specific investment objectives, financial situation, and needs of any specific person who may receive it, and is not held out as independent investment research and may have been acted upon by persons connected with CFI. Market data is derived from independent sources believed to be reliable, however, CFI makes no guarantee of its accuracy or completeness, and accepts no responsibility for any consequence of its use by recipients.






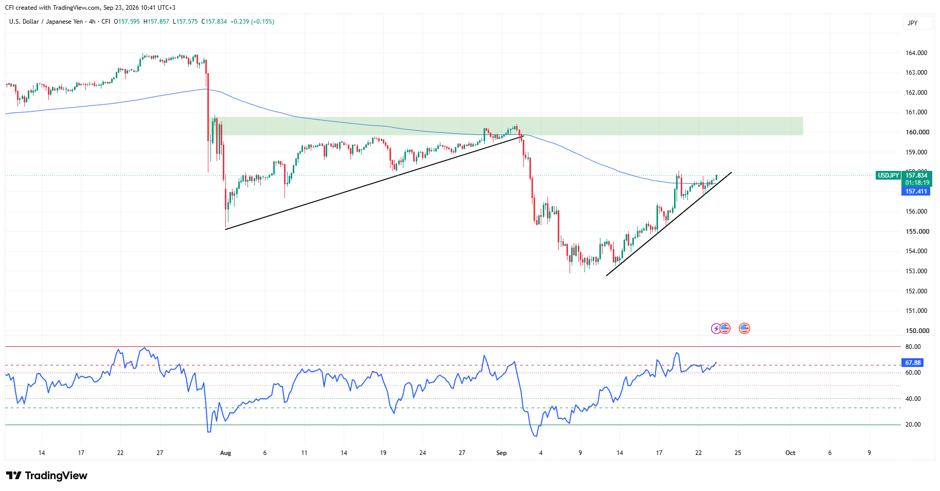 USDJPY, Time frame: 4H
-1790848069.webp)

-1790754656.webp)

-1790668063.webp)
