AUD/USD has spent much of 2026 compressing
between a descending resistance trendline and rising trend support. Repeated
failures near 0.7220–0.7270 have kept the upper side capped, while higher lows
have supported the broader consolidation.
The latest decline has now pushed price
toward the rising trendline near 0.6930–0.6950, putting that structure under
pressure.
200-Day Moving Average
One of the key technical developments is
the move below the 200-day moving average near 0.7030. The average had
supported price during previous stages of the recovery, but AUD/USD is now
trading clearly beneath the indicator around 0.6938.
The 0.7000–0.7030 area therefore becomes an
important technical reference on any recovery attempt.
Rising Trendline Faces a Key Test
Price is now testing the rising trendline
around 0.6930–0.6950. This trendline has helped define the sequence of higher
lows since early 2026, with previous tests attracting buyers.
The current reaction is important because
price is testing trend support while simultaneously trading below the 200-day
moving average.
RSI Moves into Oversold Territory
The RSI has fallen sharply to around 27,
dropping below the traditional 30 oversold threshold and sitting well below its
signal line near 39.5.
This confirms strong downside momentum
behind the recent selloff. At the same time, the oversold reading shows that
momentum has become increasingly stretched as price approaches trendline
support.
Long-Term Resistance
The descending trendline around
0.7200–0.7250 remains the major resistance area on the chart. Both the May and
September rallies stalled around this trendline, reinforcing the importance of
the zone.
Closer to the current price, the 200-day moving
average near 0.7030 is the first notable technical hurdle.
Disclaimer: The content published above has been prepared by CFI for informational purposes only and should not be considered as investment advice. Any view expressed does not constitute a personal recommendation or solicitation to buy or sell. The information provided does not have regard to the specific investment objectives, financial situation, and needs of any specific person who may receive it, and is not held out as independent investment research and may have been acted upon by persons connected with CFI. Market data is derived from independent sources believed to be reliable, however, CFI makes no guarantee of its accuracy or completeness, and accepts no responsibility for any consequence of its use by recipients.






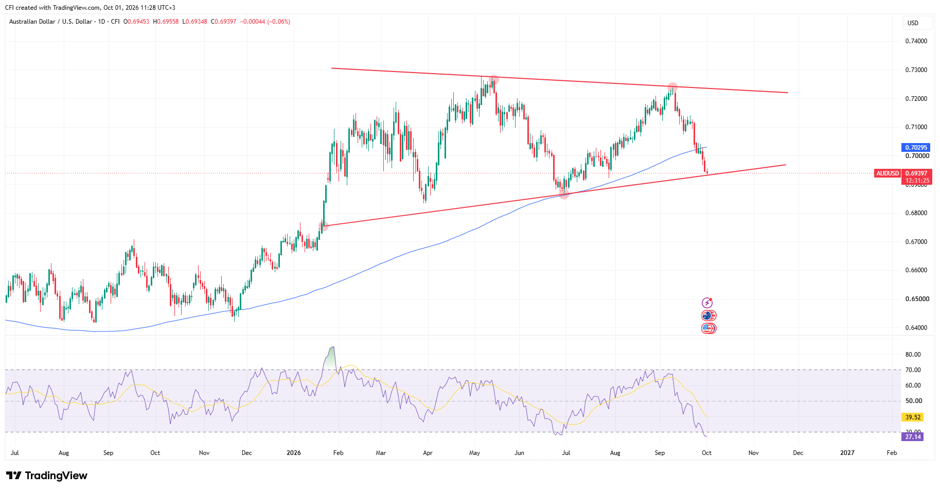 AUDUSD, Time frame: daily
 -1790754656.webp)


-1790668063.webp)
-1790235577.webp)
