GBP/USD 4h: Breaks Below Key Volume Support according to technical analysts
Lismore Burke
July 14, 2026
GBP/USD, Time frame: 4H, Source: Tradingview
GBP/USD had been respecting a well-defined
ascending channel on the 4-hour timeframe, with higher highs and higher lows
supporting the recovery from the June low. However, after failing to sustain
momentum near the channel highs around 1.3450, price rotated lower and has now
broken below the lower channel boundary.
1.3388 Turns Into Key Resistance
The most important level on the chart is
the 1.33879 Point of Control (POC), marked by the bold black horizontal line.
This level represents the highest concentration of trading activity within the
visible range and has acted as a major area of market acceptance.
Price is currently trading below the POC,
indicating that sellers have pushed the market beneath a key value area. As
long as GBP/USD remains below 1.3388, this zone is likely to act as resistance
rather than support.
High-Volume Area
The volume profile shows a substantial
concentration of volume between 1.3360 and 1.3400, highlighting this region as
an institutional fair-value area.
The recent break below this zone suggests
the market is moving away from a previously balanced area and could begin
searching for liquidity at lower price levels.
Low-Volume Zone Below Current Price
One notable feature of the volume profile
is the relatively thin volume area between 1.3250 and 1.3300. This low-volume
pocket represents an area where less trading activity previously occurred.
If downside pressure continues, price may
move through this region more quickly due to the lack of significant historical
participation compared with the higher-volume zone above.
RSI Supports the Shift in Momentum
The RSI is currently around 43.8, below the
neutral 50 level and below its moving average. Momentum has clearly weakened
from the highs seen earlier in July, indicating that bullish control has faded.
Importantly, RSI is not yet oversold,
suggesting there is still room for further downside movement before momentum
reaches extreme levels.
Disclaimer: The content published above has been prepared by CFI for informational purposes only and should not be considered as investment advice. Any view expressed does not constitute a personal recommendation or solicitation to buy or sell. The information provided does not have regard to the specific investment objectives, financial situation, and needs of any specific person who may receive it, and is not held out as independent investment research and may have been acted upon by persons connected with CFI. Market data is derived from independent sources believed to be reliable, however, CFI makes no guarantee of its accuracy or completeness, and accepts no responsibility for any consequence of its use by recipients.






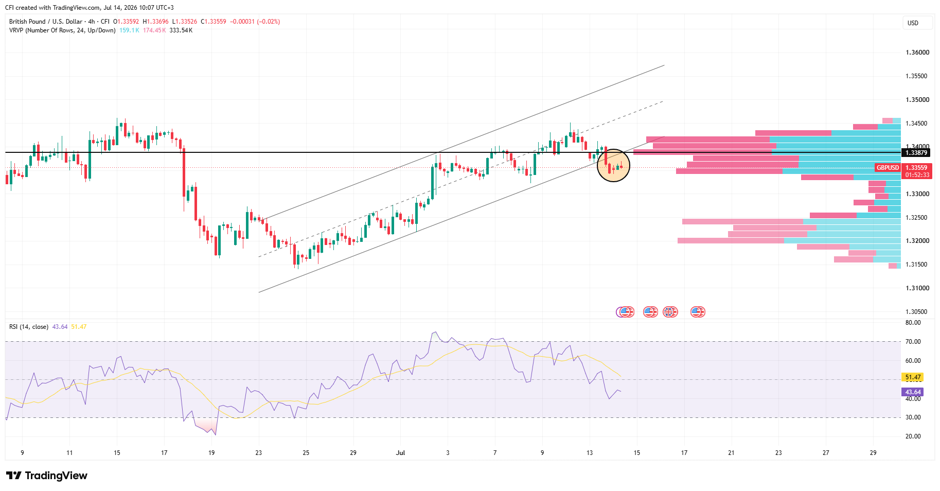 GBP/USD, Time frame: 4H, Source: Tradingview
-1784791951.webp)


-1784628086.webp)
-1724934015.webp)
-1782988482.webp)