Figure: EURCAD, Time frame: H4, Source: TradingView
Fundamental Outlook
From a fundamental perspective, investors are
awaiting key economic data from both the Eurozone and Canada, which could play
a major role in determining the pair's next direction.
On one hand, the European Central Bank
continues to monitor inflation and economic growth to assess the future path of
monetary policy. Meanwhile, market participants remain focused on any comments
that could provide clues regarding the timing and pace of future interest rate
decisions.
In Canada, the Canadian dollar remains closely
tied to oil prices, given the country's status as one of the world's largest
energy exporters.
As a result and according to analysts preview , any increase in oil prices could strengthen the
Canadian dollar and weigh on EUR/CAD, while weaker oil prices may provide the
pair with room to extend its gains.
In addition, inflation data, retail sales,
labor market figures, and shifts in global risk sentiment are expected to
remain among the key drivers influencing the pair in the coming sessions.
Technical Outlook
From a technical perspective, EUR/CAD
continues to trade within a broader downtrend on the 4-hour chart, forming a
sequence of lower highs and lower lows, reflecting the persistence of bearish
momentum.
Although the pair has rebounded from its most
recent low near the key psychological level of 1.60000, the recovery is still
viewed as a corrective move within the broader bearish trend.
According to technical analysts, The pair could
resume its decline upon reaching the supply zone between 1.60840 and 1.61010,
which coincides with the 78.6% and 88.6% Fibonacci retracement levels,
respectively, reinforcing the area's significance as a technical resistance
zone.
To maintain the bearish outlook, the price
should remain below 1.61148. A break and close above this level could signal
weakening downside momentum and increase the likelihood of a broader bullish
correction.
Disclaimer: The content published above has been prepared by CFI for informational purposes only and should not be considered as investment advice. Any view expressed does not constitute a personal recommendation or solicitation to buy or sell. The information provided does not have regard to the specific investment objectives, financial situation, and needs of any specific person who may receive it, and is not held out as independent investment research and may have been acted upon by persons connected with CFI. Market data is derived from independent sources believed to be reliable, however, CFI makes no guarantee of its accuracy or completeness, and accepts no responsibility for any consequence of its use by recipients.



-1724934015.webp)


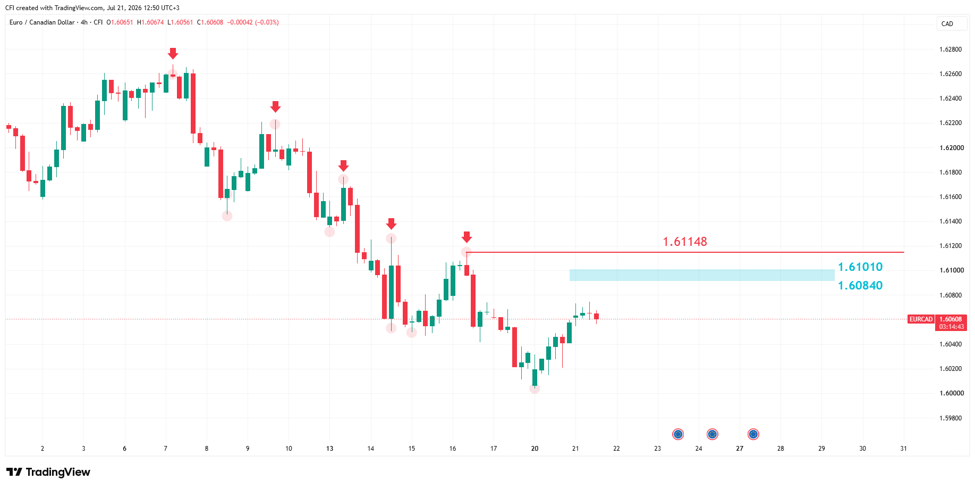 Figure: EURCAD, Time frame: H4, Source: TradingView
 -1784791951.webp)


-1784711549.webp)

-1784026383.webp)