AUD/JPY 1D Technical Analysis: Demand Zone Under Pressure Ahead of the BoJ
Lismore Burke
September 15, 2026
AUD/JPY, Time frame: 1D, Source: TradingView
AUD/JPY has spent much of 2026 trading in a
range, with buyers consistently defending the 109.00-109.50 support zone and
sellers repeatedly emerging near 114.20-115.00 resistance.
The latest decline from the September highs
has brought price back toward the lower end of that range, placing the pair at
a key technical level ahead of the Bank of Japan (BoJ) decision.
109.00–109.50 Demand Zone Remains Key
The chart highlights a well-established
support area around 109.00-109.50, where buyers have previously stepped in on
multiple occasions.
The current test is notable because it
follows another rejection from the upper resistance zone near 115.00,
reinforcing the broader range structure that has contained price action for
several months.
For now, buyers are attempting to defend
this support region once again.
111.00 Level Turns Into Immediate
Resistance
The dashed horizontal line around 111.00
has acted as a key pivot throughout the year.
After the recent sell-off, the price has
now fallen below this level, making it immediate resistance. Any recovery
attempt will likely need to reclaim the 111.00 area before bullish momentum can
rebuild.
RSI Near Oversold Territory
The RSI has fallen to approximately 31, its
lowest reading since the August selloff.
While not yet showing a strong bullish
reversal signal, the indicator suggests downside momentum has become
increasingly stretched as price approaches a major support zone.
This combination of weak momentum and key
support often attracts increased attention from traders.
BoJ in Focus
The
upcoming BoJ decision adds another layer of uncertainty to the setup.AUD/JPY is
particularly sensitive to shifts in Japanese monetary policy because changes in
rate expectations directly affect yen-funded carry trades. Any surprise from
the BoJ could trigger volatility around the current support area and influence
whether the existing range continues to hold.
Disclaimer: The content published above has been prepared by CFI for informational purposes only and should not be considered as investment advice. Any view expressed does not constitute a personal recommendation or solicitation to buy or sell. The information provided does not have regard to the specific investment objectives, financial situation, and needs of any specific person who may receive it, and is not held out as independent investment research and may have been acted upon by persons connected with CFI. Market data is derived from independent sources believed to be reliable, however, CFI makes no guarantee of its accuracy or completeness, and accepts no responsibility for any consequence of its use by recipients.






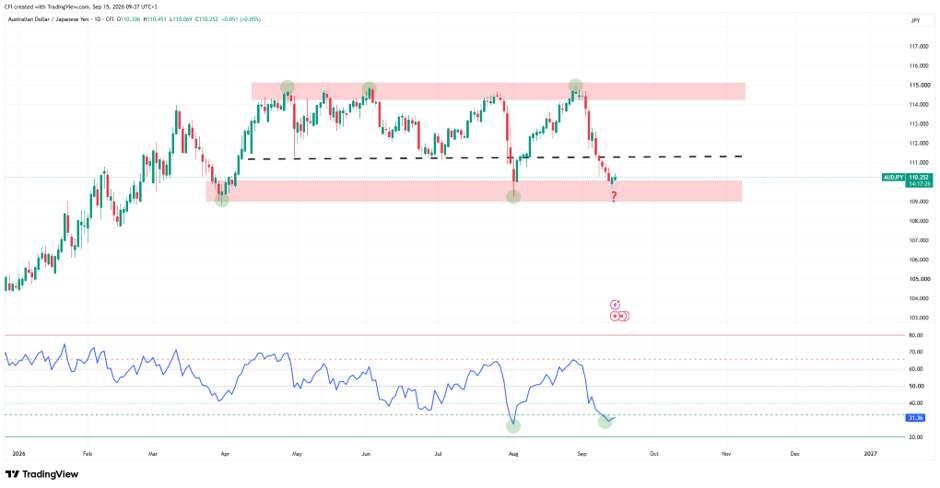 AUD/JPY, Time frame: 1D, Source: TradingView
-1790848069.webp)

-1790754656.webp)

-1790668063.webp)