Nasdaq Trading Sideways Within a Symmetrical Triangle
Mohannad Said
June 25, 2026
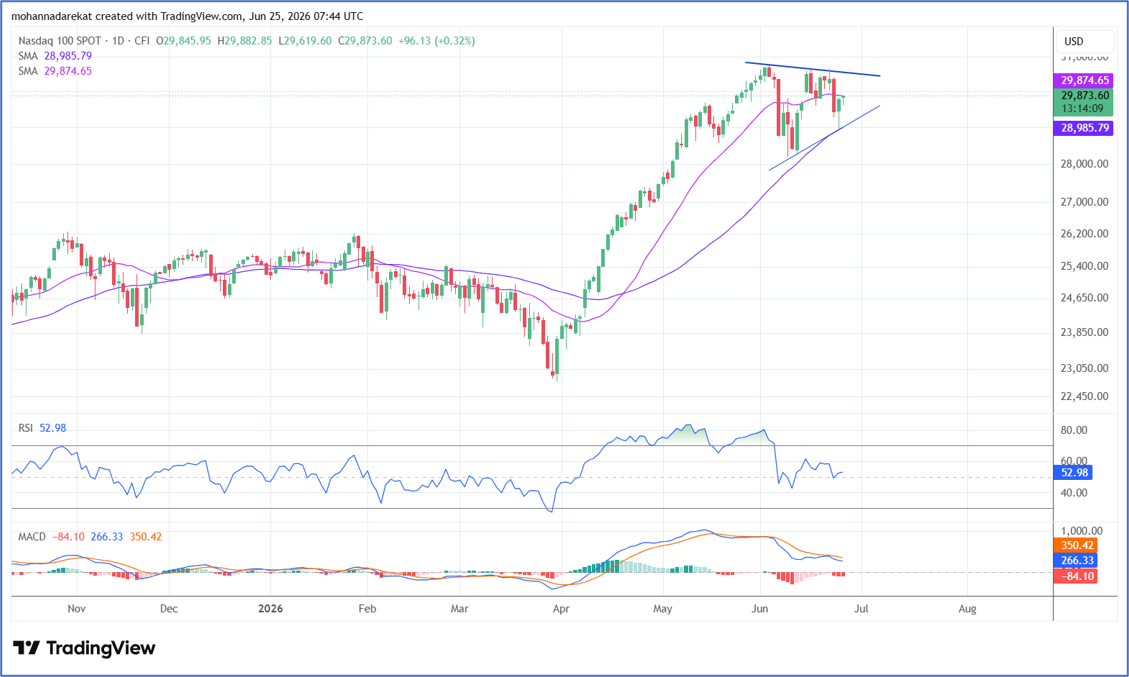
US100, Time frame: Daily, Tools: SMA 20+50
A closer look at the Nasdaq Index shows that
price action is currently moving sideways within a symmetrical triangle
pattern, a technical formation characterized by lower highs and higher lows.
This pattern helps anticipate the market's next move, whether through a
breakout above the triangle's resistance or a breakdown below its support.
Symmetrical triangles can act as either continuation or reversal patterns,
depending on how price behaves once it exits the formation.
Therefore, we will closely monitor the 30,700 level as a key resistance area,
while the 29,000 level represents an important support zone, further reinforced
by the 50-day moving average. Additionally, the 29,700 level can be viewed as a
pivotal point for the Nasdaq, as it has previously acted as a significant
reversal area, making it an important level to watch in determining the index's
next directional move.
Disclaimer: The content published above has been prepared by CFI for informational purposes only and should not be considered as investment advice. Any view expressed does not constitute a personal recommendation or solicitation to buy or sell. The information provided does not have regard to the specific investment objectives, financial situation, and needs of any specific person who may receive it, and is not held out as independent investment research and may have been acted upon by persons connected with CFI. Market data is derived from independent sources believed to be reliable, however, CFI makes no guarantee of its accuracy or completeness, and accepts no responsibility for any consequence of its use by recipients.


 US100, Time frame: Daily, Tools: SMA 20+50
-1781091313.webp)
-1724934015.webp)
-1781089603.webp)
-1779271654.webp)