Big Tech Q2 Earnings: Critical Trends Meet A Cautious Fed
Lismore Burke
July 15, 2026
introduction
Wall Street has entered a new phase of the
artificial intelligence trade. For the past two years, hyperscalers could
announce bigger capital expenditure budgets and watch their stock prices climb
in response. That era appears to be ending. As Q2 2026 earnings season builds
toward its biggest test in late July, investors are no longer asking how much
the largest technology companies are spending on AI infrastructure; they're
asking what they're getting back for it. And this week, that question got an
unexpected macro backdrop: Federal Reserve Chairman Kevin Warsh's first
congressional testimony.
The Number Everyone Is Watching
Alphabet, Microsoft, Meta, and Amazon
have together spent over $220 billion on capital expenditure for artificial
intelligence in the last four quarters. Guidance for 2026 capex spending for
the quartet of hyperscalers can get as high as $725 billion. The key measure
being discussed on analyst calls is the AI capex/revenue ratio and whether this
expenditure is manifesting itself as cloud revenue growth or as an increase in
depreciation expense. Growth numbers for Azure, AWS, and Google Cloud will be
scrutinized line by line, and anything signaling spending ahead of demand will
be harshly penalized.
The Calendar
Alphabet reports July 22
Microsoft and Meta report July 29
Apple and Amazon follow July 30
Nvidia doesn't report until late August
Nearly the entire AI-infrastructure complex, minus Nvidia, will report within
nine days, with Nvidia's later report serving as either a confirmation or a
reckoning depending on how the rest of the month goes.
On Tuesday 14 July, Warsh delivered his
first semi-annual monetary policy testimony to the House Financial Services
Committee, just hours after data showed June inflation cooled to 3.5% annually
from 4.2% in May. Warsh made clear the Fed isn't declaring victory: he said the
Committee has no tolerance for persistently elevated inflation and remains
resolutely committed to restoring price stability. Rates stayed at 3.5%–3.75%
at June's meeting, and markets currently price an 86% probability of a hold at
the next one. More striking for the earnings story: Warsh himself pointed to
the AI capex boom as a macroeconomic force, calling the current pace of
business investment the most notable feature of the economy and attributing it
largely to data center construction and demand for AI-related equipment. That's
a Fed chair effectively confirming, from national accounts, the same spending
wave now under the market's microscope.
Why This Matters for Positioning
Hyperscaler valuations aren't judged on
capex-to-revenue ratios alone; they also hinge on the discount rate investors
apply to future cash flows. A Fed that stays cautious on inflation despite a
cooler print keeps rates higher for longer, raising the bar for how much cloud
growth is needed to justify today's valuations. A steady-rate backdrop, which
is what markets currently expect, gives Alphabet, Microsoft, Meta, and Amazon a
bit more room to be judged on their own numbers rather than through a
tightening lens. The two storylines are now intertwined. The first three weeks
of July set the macro tone: inflation data, Fed testimony, rate expectations.
The real test starts July 22 and compresses into nine days through July 30.
Whether hyperscalers can show that a $725 billion spending program is paying
for itself will do more to shape the broader market's trajectory than anything
else in this earnings season, and it will play out against a monetary backdrop
that, for now, isn't standing in the way.
NAS100: The Analysts' Technical Take
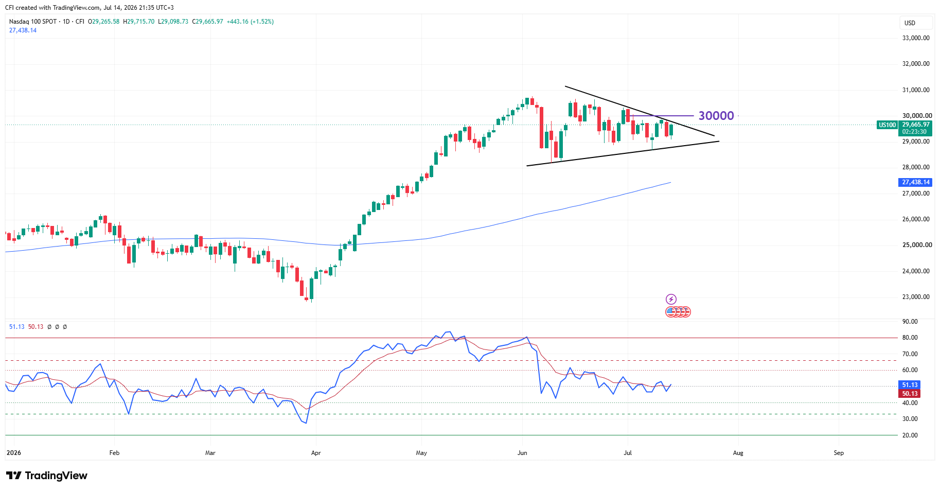
Nasdaq 100, Time frame: 1D, Source: Tradingview
The Nasdaq 100 continues to trade in range following its rally from about
25,000 in April to the high of 30,700 in early June. Over the last six weeks,
trading activity has been confined to a symmetrical triangle formation below
the 30,000 mark, indicating a contraction in volatility and a balance between bulls
and bears. CFI Custom RSI (14-period RSI with 9 Period EMA) is trading near the
50 level, indicating neutrality.
Disclaimer: The content published above has been prepared by CFI for informational purposes only and should not be considered as investment advice. Any view expressed does not constitute a personal recommendation or solicitation to buy or sell. The information provided does not have regard to the specific investment objectives, financial situation, and needs of any specific person who may receive it, and is not held out as independent investment research and may have been acted upon by persons connected with CFI. Market data is derived from independent sources believed to be reliable, however, CFI makes no guarantee of its accuracy or completeness, and accepts no responsibility for any consequence of its use by recipients.





 Nasdaq 100, Time frame: 1D, Source: Tradingview
-1785155028.webp)

-1784891295.webp)
-1724934015.webp)
-1784711272.webp)
