The Dow Jones (US30) has broken below the
lower trendline of the ascending channel that guided the rally from April
through August. The channel had consistently produced higher highs and higher
lows, but the recent decline has pushed price beneath this support structure,
marking a shift in the near-term technical landscape.
Bollinger Bands
Price has moved below the Bollinger midline
and is now trading closer to the lower band, highlighting a loss of upside
momentum following the rejection from the August highs. While previous
pullbacks into the lower Bollinger Band attracted buyers, the latest decline
has produced a more muted response, suggesting recovery momentum remains
limited for now.
51,583 Emerges as the Next Major Support
With the channel support now broken, focus
shifts to 51,583, which represents the next significant support level below
current price. This area previously acted as a key reaction zone during earlier
pullbacks and could become an important area where buyers attempt to regain
control.
Should selling pressure intensify, the next
major reference level sits near 49,672, which marked the base of the broader
advance earlier this year.
54,000 Remains the Key Resistance Zone
The August peak near 54,010 continues to
act as the dominant resistance level overhead. Before a retest of the highs
becomes realistic, buyers would need to reclaim the broken channel support and
establish acceptance back above the 53,100–53,700 region.Until then, rallies
may continue to encounter resistance within the former support zone.
Momentum Shows Early Signs of
Stabilising
The
RSI is currently holding around 43.5, recovering slightly from its weakest
reading since late August. Although the indicator remains below the neutral 50
level, the recent uptick suggests downside momentum may be starting to moderate
after the sharp decline from the highs. At this stage, momentum reflects
stabilisation rather than a confirmed recovery.
Disclaimer: The content published above has been prepared by CFI for informational purposes only and should not be considered as investment advice. Any view expressed does not constitute a personal recommendation or solicitation to buy or sell. The information provided does not have regard to the specific investment objectives, financial situation, and needs of any specific person who may receive it, and is not held out as independent investment research and may have been acted upon by persons connected with CFI. Market data is derived from independent sources believed to be reliable, however, CFI makes no guarantee of its accuracy or completeness, and accepts no responsibility for any consequence of its use by recipients.






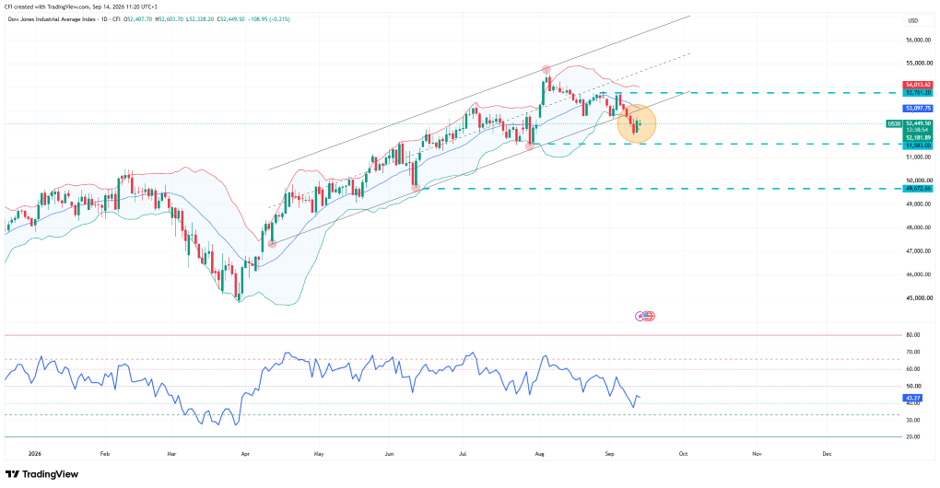 Dow jones, Time frame: 1 D


-1790847824.webp)
-1790667493.webp)