Technical analysis is an analysis methodology for forecasting the direction of prices through the study of past market data, such as price and volume. It is a tool traders use to predict future price movements, based on historical patterns and trends. Learning the basic concepts of technical analysis can give traders a useful advantage in the market.
What is Technical Analysis?
At the most basic level, technical analysis is based on the analysis of price charts and market data in the expectation of future price movements. It’s different from fundamental analysis, which considers a company’s fundamentals from its balance sheet to the broader economic conditions and solely concentrates on price patterns, volume, or other market indicators such as RSI (Relative Strength index) for example.
Key Elements of Technical Analysis:
- Price Charts: Charts displaying price movements over time. Such charts are used to screen potential trades as they can show a trader market trends, patterns and market sentiment.
- Volume: (Seen in the middle colored in green/red) The number of shares or contract traded in a security or market during a given period of time. Volume in trading is used to assess the strength of a price move.
- Indicators: (Seen in the bottom line graph) Tools such as moving averages, RSI – Relative Strength Index – used in determining market trends and momentum.
Key Technical Analysis Strategies
For beginner traders, there are a couple of core strategies that could help to guide your technical analysis practices.
Trend Following:
The most common strategy is following trends. This means identifying when an asset is trending upward or downward and making trades that align with the trend. Traders use moving averages and trend lines to determine the direction of the trend and ride it for potential profits.
For example, we have here the currency pair (EUR/JPY) as we can see a pure trend line in (black) with a clear upward direction.
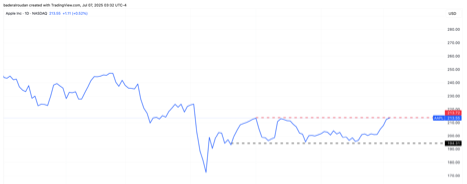
Support and Resistance Levels:
Support is the price level where a downward trend can be expected to pause due to demand. Resistance is the opposite, it’s where an upward trend can slow down or reverse. Identifying these levels helps to determine potential entry or exit points. For example, we can see the stock price trading between Support (black dash) and Resistance (red dash) levels. Every time the price reaches the support it bounces back up, and once it reaches the resistance level it bounces back down, a break above or below these levels will determine the price direction.
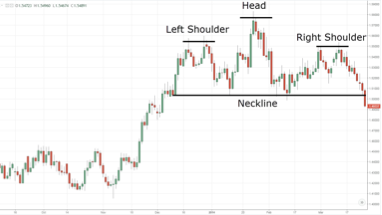
Chart Patterns:
Chart patterns, like head and shoulders or double tops/bottoms, are formations on a price chart that indicate potential price reversals or continuations. These patterns are typically used to predict when a trend is about to change. As shown, we can see that head and shoulders pattern has occurred, a break of it’s neckline, will likely indicate price will reverse from an uptrend to a downfall downtrend.
Momentum Indicators:
Momentum indicators, like the Relative Strength Index (RSI), help measure the speed of price movements. If an asset is overbought or oversold, these indicators can signal potential reversals.
Volume Analysis:
Volume analysis can help confirm price trends. A price movement accompanied by high volume is often seen as more significant than the same price movement on low volume. This can indicate that the trend has strength and may continue.
Getting Started with Technical Analysis
Beginners who want to engage in technical trading should follow a few steps to increase their understanding:
1. Understand What a Price Chart Is:
Start with the basic types of charts: a lines or candlesticks. "Because they provide more information about price movements, candlestick charts are especially popular for technical analysis."
Line Chart CandleSticks Chart
2. Use Simple Indicators:
Begin with some basic indicators such as moving averages or the RSI. These techniques are intuitive and can provide clear signals on when an asset is overbought, oversold, or trending.
3. Practice with Demo Trading:
Try out technical analysis on demo trading platforms before risking any real capital. This gives the beginners a opportunity to try out the strategies without losing money.
4. Develop a Trading Plan:
Develop a strategy according to technical analysis that has rules for entering and exiting trades. Being disciplined should prevent any emotional decisions, which is key to success.
5. Stay Patient and Consistent:
Technical analysis is a skill that takes time and practice to develop.
Conclusion
It is very helpful for stock traders, especially beginners, to predict price movements analyzing historical data. New traders can establish a strong foundation by mastering key strategies such as trend following, support and resistance, chart patterns, momentum indicators, and volume analysis. The key is to get started small, trade as often as possible, and work on a trading plan to apply technical analysis on the financial market.
Disclaimer: The content published above has been prepared by CFI for informational purposes only and should not be considered as investment advice. Any view expressed does not constitute a personal recommendation or solicitation to buy or sell. The information provided does not have regard to the specific investment objectives, financial situation, and needs of any specific person who may receive it, and is not held out as independent investment research and may have been acted upon by persons connected with CFI. Market data is derived from independent sources believed to be reliable, however, CFI makes no guarantee of its accuracy or completeness, and accepts no responsibility for any consequence of its use by recipients.


-1785155028.webp)

-1784891295.webp)
-1724934015.webp)
-1784711272.webp)
