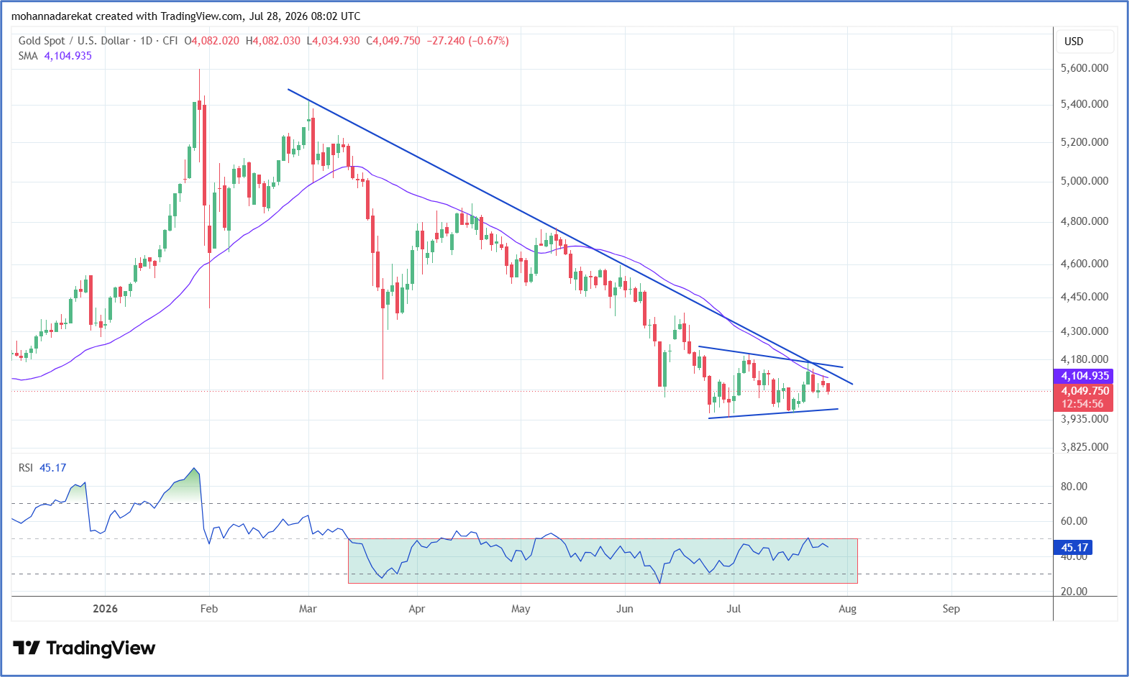
XAUUSD, Time frame: Daily, Tools: SMA35, Source: Trading view
By tracking gold price movements and based on the attached chart, we can see that the sideways trend continues within a triangle pattern, bounded by a resistance zone near the $4,200 level and a support zone around $3,950 per ounce. Today, gold is down approximately 0.6% and is trading near $4,050 per ounce. So, what factors are currently influencing gold prices?
The US dollar remains stable near its highest level in a month, around 101.5, ahead of the Federal Reserve’s interest rate decision, which will be announced tomorrow, Wednesday. Markets are currently pricing in a 63% probability that rates will remain unchanged.
Ongoing political uncertainty and caution continue to impact the global economy in general, and inflation in particular.
From a technical perspective, since price action is moving within a triangle pattern, which can either signal a continuation of the previous trend or a reversal, the following scenarios are the most likely:
A breakout above the $4,200 resistance level would suggest a bullish outlook, especially as it represents the average price resistance over the past 35 days.
A break below the $3,950 support level would indicate a bearish outlook and a continuation of the previous downtrend.
Disclaimer: The content published above has been prepared by CFI for informational purposes only and should not be considered as investment advice. Any view expressed does not constitute a personal recommendation or solicitation to buy or sell. The information provided does not have regard to the specific investment objectives, financial situation, and needs of any specific person who may receive it, and is not held out as independent investment research and may have been acted upon by persons connected with CFI. Market data is derived from independent sources believed to be reliable, however, CFI makes no guarantee of its accuracy or completeness, and accepts no responsibility for any consequence of its use by recipients.





 XAUUSD, Time frame: Daily, Tools: SMA35, Source: Trading view
-1783942758.webp)


-1782989015.webp)

-1724934015.webp)
