Natural Gas 4H Technical Analysis: Breakout Retest in Focus
Lismore Burke
September 16, 2026
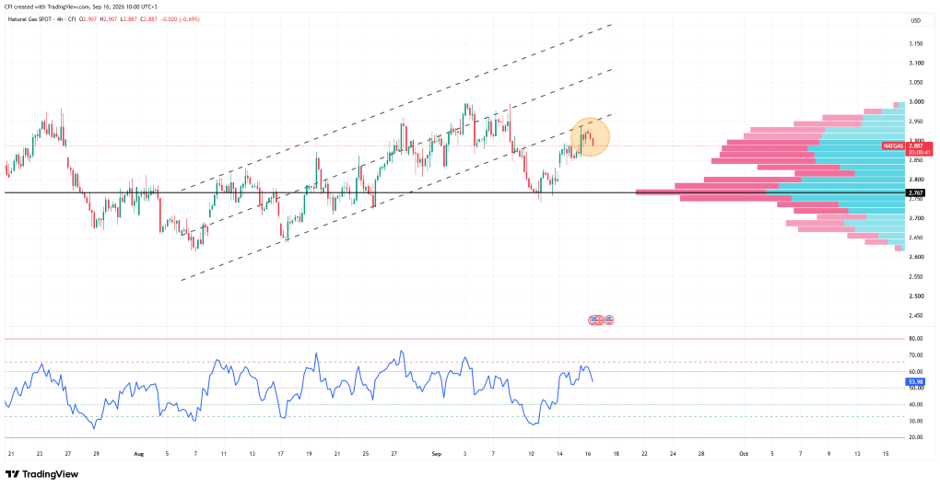
Nat Gas spot, Time frame: 4h, Source: TradingView
Natural Gas has been trading in a rising
channel on the 4H timeframe. Price initially broke below the rising channel,
signalling a loss of short-term trend support and triggering a move lower
toward the Point of Control (POC) at 2.767. However, instead of accelerating
lower, buyers stepped back in aggressively at the value area and drove price
sharply higher.
The market has now returned to test the
underside of the former channel support, highlighted by the yellow circle. This
is a classic technical setup where former support is being retested as
potential resistance.
POC at 2.767 Proves Its Importance
The most significant level on the chart
remains the 2.767 POC, marked by the black horizontal line.
The volume profile shows this as the area
with the highest concentration of traded volume, making it the market's primary
value zone. The strong bullish reaction from this level confirms that buyers
continue to view this area as fair value.
The rebound from the POC is the reason the
current breakdown remains unconfirmed from a broader structural perspective.
Break-and-Retest Zone Now the Key
Battleground
The yellow-circled area highlights the
current technical setup:
Previous channel support failed.
Price sold off toward the POC.
Buyers regained control from value.
Price rallied back into the broken
trendline.
The market is now deciding whether the
former channel support will become resistance or whether buyers can reclaim the
structure and invalidate the initial breakdown.
Heavy Volume Acceptance Between 2.80 and
2.95
The volume profile shows substantial market
participation between 2.80 and 2.95.
This suggests the market remains in a
high-acceptance area where both buyers and sellers are active. A sustained move
away from this volume shelf would likely require a stronger catalyst such as
storage data, weather forecasts, or LNG-related developments.
Momentum
The 14-period RSI is holding near 57,
recovering from the earlier selloff.
Momentum
has improved following the rebound from the POC but remains below overbought
territory, indicating the market still has room to expand in either direction.
Disclaimer: The content published above has been prepared by CFI for informational purposes only and should not be considered as investment advice. Any view expressed does not constitute a personal recommendation or solicitation to buy or sell. The information provided does not have regard to the specific investment objectives, financial situation, and needs of any specific person who may receive it, and is not held out as independent investment research and may have been acted upon by persons connected with CFI. Market data is derived from independent sources believed to be reliable, however, CFI makes no guarantee of its accuracy or completeness, and accepts no responsibility for any consequence of its use by recipients.






 Nat Gas spot, Time frame: 4h, Source: TradingView
-1790754997.webp)



-1789980568.webp)
