Gold at Its Lowest Levels Since November: What’s Next?
Omar Ayoub
July 1, 2026
Gold Under Pressure as Dollar and Yields Strengthen
Gold prices continue to face strong selling
pressure, trading near their lowest levels since November 2025 as the US dollar
and Treasury yields strengthen. The move has been driven by growing
expectations that the Federal Reserve could further tighten monetary policy if
inflationary pressures persist.
These pressures intensified following comments
from several Federal Reserve officials, who suggested that current interest
rates may not be sufficient to bring inflation back to the 2% target. As a
result, markets have increased their expectations for further interest rate
hikes in the coming months. In addition, resilient U.S. economic data,
particularly the continued strength of the labor market, has reinforced these
expectations, while investors now await upcoming US employment data for further
clues regarding the future path of monetary policy.
At the same time, markets continue to monitor
geopolitical developments, which remain an important driver of gold price
movements.
Market Outlook
Looking ahead, gold is expected to remain
highly sensitive to US economic data, particularly inflation and labor market
figures, as well as comments from Federal Reserve officials. Continued strength
in economic data and higher Treasury yields could keep gold under pressure,
while signs of a slowing US economy or declining expectations for additional
rate hikes may provide the precious metal with an opportunity to recover part
of its recent losses.
Technical Analysis
Figure: XAUUSD, H4, TradingView
From a technical perspective, gold remains in
a broader downtrend on the four-hour timeframe, continuing to form lower highs
and lower lows. The price also remains below the 200-period Simple Moving
Average (blue line), signaling that the long-term bearish outlook remains
intact. In the short term, gold continues to trade below both the 21-period
Exponential Moving Average (red line) and the 50-period Exponential Moving
Average (green line), which have acted as dynamic resistance levels, with price
repeatedly rejecting them to the downside. This continues to support the
prevailing bearish momentum over the short to medium term.
Key Support and Resistance Levels
Looking at the latest market structure between
the resistance level of 4,145.160 and the support level of 3,942.310, holding
below the resistance at 4,145.160 keeps the bearish scenario intact. However,
if the price breaks above this resistance and establishes a higher high on the
four-hour timeframe, it could signal an early reversal of the prevailing
downtrend and open the door for a renewed bullish move. On the other hand, if
gold falls below 3,942.310 and records a lower low on the four-hour chart, it may
indicate the likelihood of further selling pressure and additional downside in
the sessions ahead.
Disclaimer: The content published above has been prepared by CFI for informational purposes only and should not be considered as investment advice. Any view expressed does not constitute a personal recommendation or solicitation to buy or sell. The information provided does not have regard to the specific investment objectives, financial situation, and needs of any specific person who may receive it, and is not held out as independent investment research and may have been acted upon by persons connected with CFI. Market data is derived from independent sources believed to be reliable, however, CFI makes no guarantee of its accuracy or completeness, and accepts no responsibility for any consequence of its use by recipients.


-1724934015.webp)

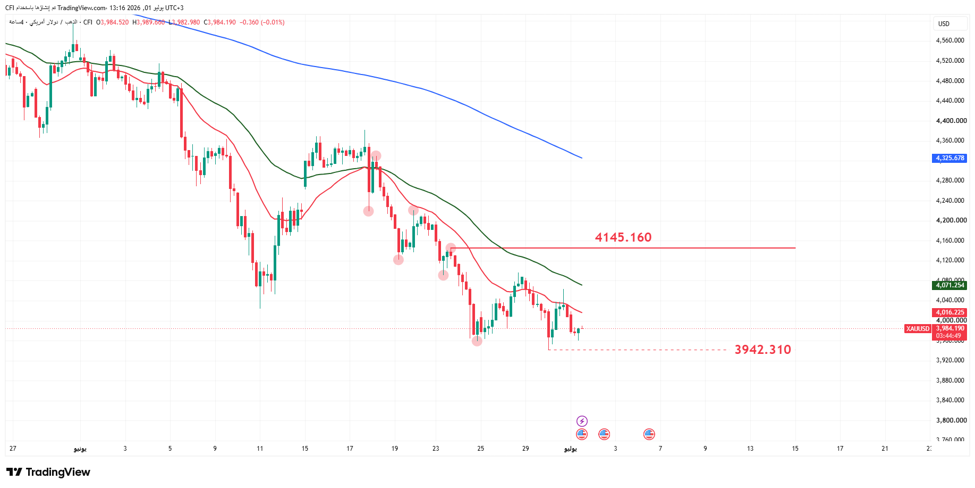 Figure: XAUUSD, H4, TradingView
-1782989015.webp)

-1782737533.webp)
-1782287857.webp)